COA Project
C vs Assembly
10 November 2023
Description
This is a small project done in my first year of my university days that I have done to explore assembly and c language. It focuses on the comparison of the execution speed of the Assembly Language and C Language using the game “FizzBuzz”.
Features
- FizzBuzz
- Perf for Measuring Execution Speed
- Raspberry Pi Linux
Reflection
Language Used:
Assembly
C
Role: Coding & Testing of Assembly and C Fizzbuzz
Introduction
As part of my studies in year 1, we were tasked with the assignment to explore Computer Organization and Architecture by making a execution test comparison between Assembly language and C Language. We decided on FizzBuzz as our function to use compare execution speeds.
FizzBuzz Program
FizzBuzz is essentially a function that has a counter that increments within a loop and prints “Fizz” when the counter is divisible by 3, “Buzz” when the counter is divisble by 5 and “FizzBuzz” when it is divisble by 3 and 5 (aka 15).
Below are flowcharts that represent this FizzBuzz Test in both Assembly and C.
Assembly FizzBuzz Flowchart
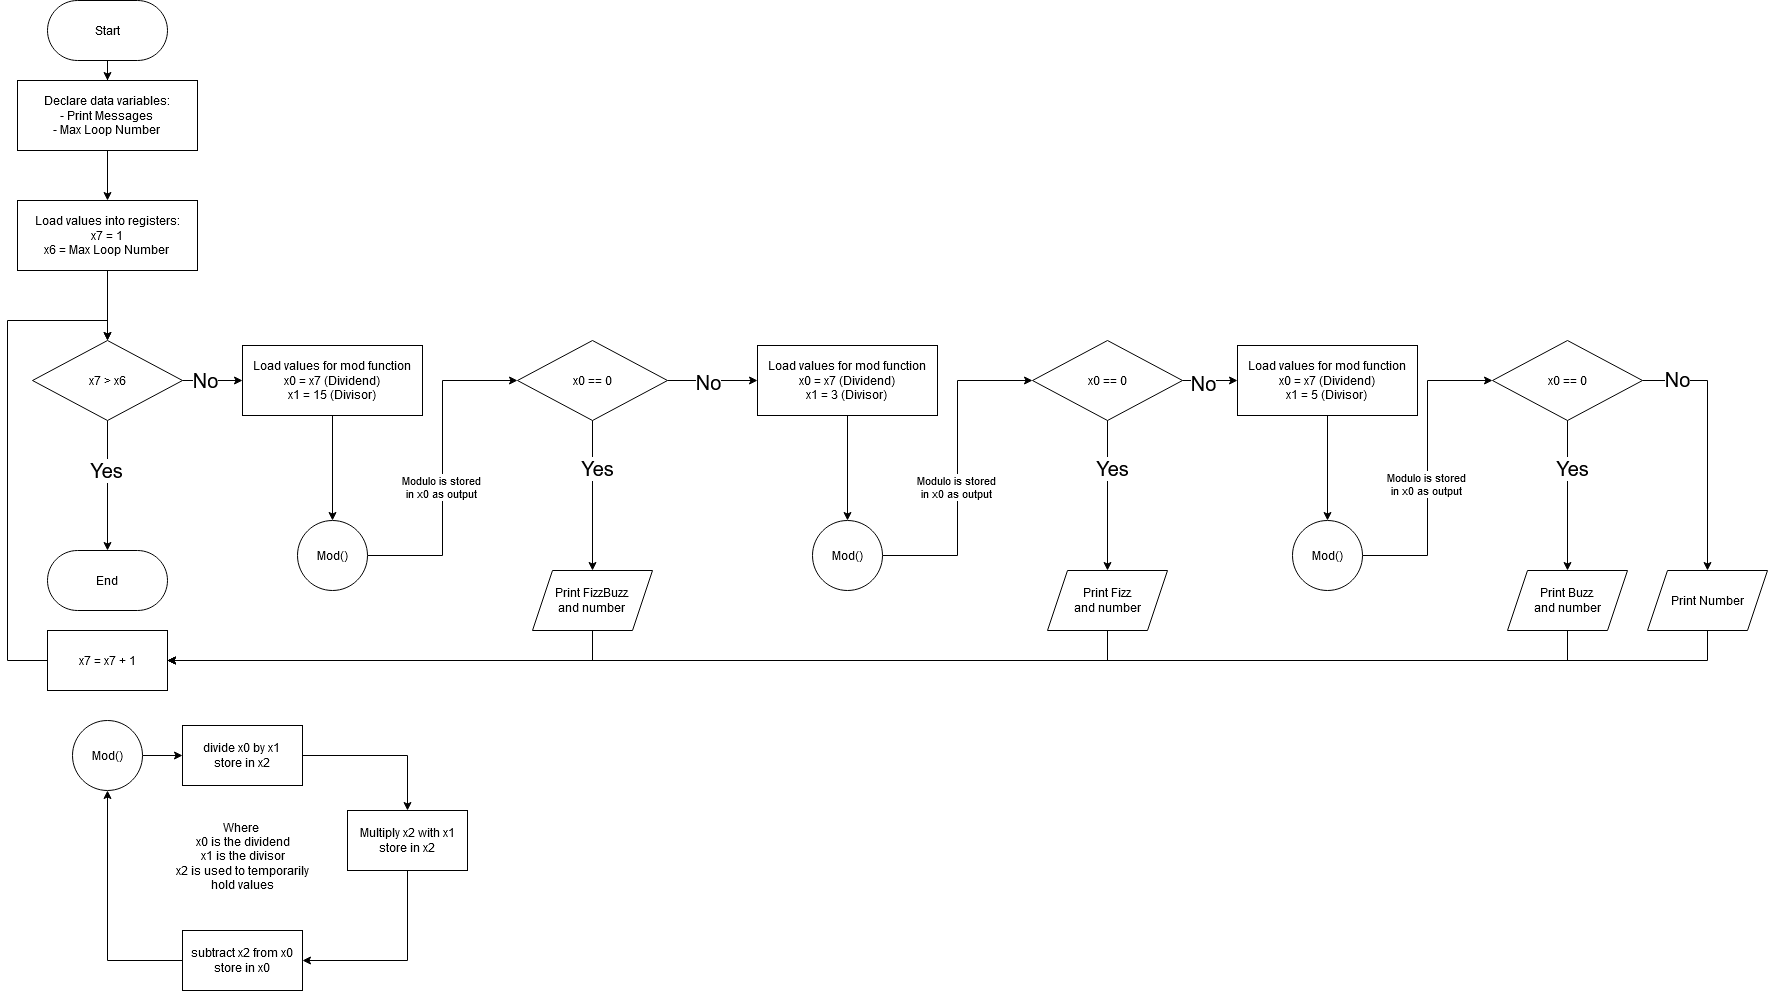
C FizzBuzz Flowchart

The following are the code for the FizzBuzzes:
.data //Data section, declare your variables here
_fizzMessage: //Message printed when a number is divisible by 3
    .asciz "Fizz (%lu)\n"
_buzzMessage:   //Message printed when a number is divisible by 5
    .asciz "Buzz (%lu)\n"

_fizzBuzzMessage: //Message printed when a number is divisible by 15
    .asciz "FizzBuzz (%lu)\n"

_currentNumMessage: //Message printed when a number is divisible by 3
    .asciz "%lu\n"

_maxLoopNumber: //The number the fizzbuzz program will iterate towards
    .quad   1000000//Set your number value here
    //.quad 1000000000000000000 // Max value you can set

.text //Code should be declared under here
.global main

.include "mod.s" //Modulo function
.include "exit.s" //Exit function

main:

    // --- Declare register values ---
    mov     x7, #1      //let x7 be the currentLoopNumber in the for loop, starting from 1
    ldr     x6, =_maxLoopNumber //Load the max Loop number address into x6
    ldr     x6, [x6] //Load the value from max loop number address into x6

LOOP:
    cmp     x7, x6 // Compare x7 and x6
    //--- if x7 == max loop number ---
    bgt    Exit //exit program
    //--- Else ---

    // ___ V Check for FIZZBUZZ V ___
    mov x0 , x7 //Pass current loop number as Mod dividend argument
    mov x1 , #15 //Pass 15 as divisor
    bl Mod //After this line, x0 holds the remainder of x7 /15

    //--- If remainder == 0 ---
    cbz x0 , _FizzBuzzPrint //print fizzbuzz
    // ___ ^ Check for FIZZBUZZ ^ ___

    //--- Else ---

    // ___ V Check for FIZZ V ___
    mov x0 , x7 //Pass current loop number as Mod dividend argument
    mov x1 , #3 //Pass 3 as divisor
    bl Mod //After this line, x0 holds the remainder of x7 / 3

    //--- If remainder == 0 ---
    cbz x0 , _FizzPrint //print fizz

    // ___ ^ Check for FIZZ ^ ___

    //--- Else ---

    // ___ V Check for BUZZ V ___
    mov x0 , x7 //Pass current loop number as Mod dividend argument
    mov x1 , #5 //Pass 5 as divisor
    bl Mod //After this line, x0 holds the remainder of x7 / 3

    //--- If remainder == 0 ---
    cbz x0 , _BuzzPrint //print fizz

    // ___ ^ Check for BUZZ ^ ___
    //--- Else ---

    bl _PrintCurrentNumMessage
    add     x7, x7, #1 //Increment x7 by 1
    b       LOOP    // Let code flow to LOOP function


//=== V Print Functions V ===
_PrintCurrentNumMessage:
    //Saves the address line of _PrintCurrentNumMessage from x30
    //Register Dependencies: x0, x1, x6 ,x7

    sub sp, sp, #96 //Reserve 80 bits for x7, x6 and return address line (16 bits + 16 bits + 64 bits respectively)
    str x30, [sp] //Store return address onto stack
    str x7, [sp,#16] //Store value of x7 in stack 16bits from the start of stack
    str x6, [sp,#32] //Store value of x6 in stack 32bits from the start of stack

    //prints the debug message
    mov x1 , x7
    ldr x0 , =_currentNumMessage
    bl printf


    ldr x6, [sp,#32]// Restore the value of x6
    ldr x7, [sp,#16]// Restore the value of x7
    ldr x30, [sp] //Load x30 to have it's prev address line
    add sp, sp, #96 //Restore 80 bits for address line
    ret


//=== ^ Print Functions ^ ===

//=== V FizzBuzz Functions V ===
_FizzBuzzPrint:
   //Saves the address line of _PrintCurrentNumMessage from x30
    sub sp, sp, #96 //Reserve 80 bits for x7, x6 and return address line (16 bits + 16 bits + 64 bits respectively)
    str x30, [sp] //Store return address onto stack
    str x7, [sp,#16] //Store value of x7 in stack 16bits from the start of stack
    str x6, [sp,#32] //Store value of x6 in stack 32bits from the start of stack

    //prints the debug message
    mov x1 , x7 //Pass value of current loop number as printf argument into x1
    ldr x0 , =_fizzBuzzMessage //Pass format of fizzbuzz message into x0
    bl printf //Call printf


    ldr x6, [sp,#32]// Restore the value of x6
    ldr x7, [sp,#16]// Restore the value of x7
    ldr x30, [sp] //Load x30 to have it's prev address line
    add sp, sp, #96 //Restore 80 bits for address line


    add     x7, x7, #1 //Increment x7 by 1
    b       LOOP    // Let code flow to LOOP function


_FizzPrint:
   //Saves the address line of _FizzPrint from x30
    sub sp, sp, #96 //Reserve 80 bits for x7, x6 and return address line (16 bits + 16 bits + 64 bits respectively)
    str x30, [sp] //Store return address onto stack
    str x7, [sp,#16] //Store value of x7 in stack 16bits from the start of stack
    str x6, [sp,#32] //Store value of x6 in stack 32bits from the start of stack

    //prints the debug message
    mov x1 , x7 //Pass value of current loop number as printf argument into x1
    ldr x0 , =_fizzMessage //Pass format of fizz message into x0
    bl printf //Call printf

    ldr x6, [sp,#32]// Restore the value of x6
    ldr x7, [sp,#16]// Restore the value of x7
    ldr x30, [sp] //Load x30 to have it's prev address line
    add sp, sp, #96 //Restore 80 bits for address line


    add     x7, x7, #1 //Increment x7 by 1
    b       LOOP    // Let code flow to LOOP function


_BuzzPrint:
   //Saves the address line of _BuzzPrint from x30
    sub sp, sp, #96 //Reserve 80 bits for x7, x6 and return address line (16 bits + 16 bits + 64 bits respectively)
    str x30, [sp] //Store return address onto stack
    str x7, [sp,#16] //Store value of x7 in stack 16bits from the start of stack
    str x6, [sp,#32] //Store value of x6 in stack 32bits from the start of stack

    //prints the debug message
    mov x1 , x7 //Pass value of current loop number as printf argument into x1
    ldr x0 , =_buzzMessage //Pass format of buzz message into x0
    bl printf //Call printf


    ldr x6, [sp,#32]// Restore the value of x6
    ldr x7, [sp,#16]// Restore the value of x7
    ldr x30, [sp] //Load x30 to have it's prev address line
    add sp, sp, #96 //Restore 80 bits for address line


    add     x7, x7, #1 //Increment x7 by 1
    b       LOOP    // Let code flow to LOOP function

//=== ^ FizzBuzz Functions ^ ===
sudo apt install linux-perf
Measuring Execution Time
Measuring execution time of the program can be done in a multitude of ways from finding the clock cycles to using tools to record the run time of the program.
For the former, the initial idea was to use the time.h library to record the number of clock ticks elapsed over the execution of the program, then divide the value by the number of ticks per second to obtain the actual execution time of the program. However, implementing this function into the AArch64 assembly program was not as simple as implementing it into C. Moreover, utilising a C library in the assembly code may skew the results, thus, a linux tool was ultimately chosen to measure execution time instead to ensure fairness.
The linux tool used is a profiling instrument called perf. This is how the final result would look like when running perf with the FizzBuzz function to measure the execution time.
Perf Setup
The section below will be a guide on how to set up and use to measure the execution time of a program using perf on your raspberry pi.
Installing Perf
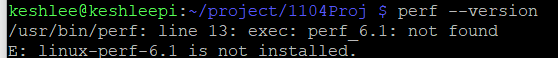
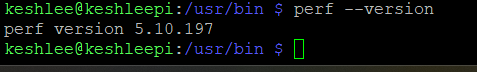
1) Firstly, we need to check if “perf” is installed on your raspberry pi by typing: perf –version. You should encounter the error as shown in the image below. In the unlikely event that you already have the correct version of perf installed on your pi, you can skip the installation section.
Now type in the command to download and install perf:
sudo apt install linux-perf
2) After downloading, from your user directory, keep typing:
cd ../
all the way until you reach the root
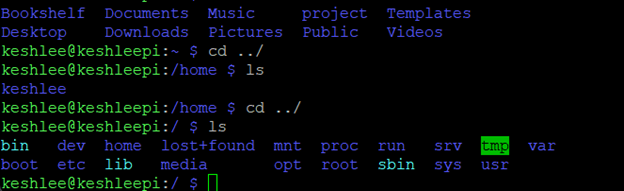
3) Change Directory to usr > bin and type:
ls
and find the “perf_
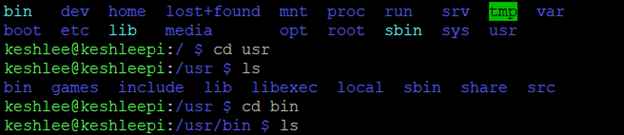
Typing “ls” will show
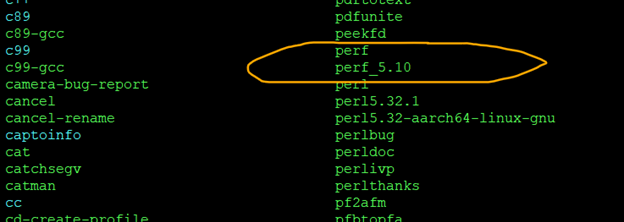
4) This next step is interesting because it is likely that you will encounter an issue with the version of perf installed. At the time when this blog is being written, the perf version installed through the command is 5.10.
However, the installed version of perf will not match with the one expected by the system which is 6.1. The system will return you the same error as seen in step 1 despite having installed perf.
To bypass this problem, type:
sudo cp /usr/bin/perf_5.10 /usr/bin/perf_6.1
We are essentially copying perf 5.10 and renaming it to 6.1 to trick the system into thinking we have perf version 6.1. Be mindful that when running this line in the terminal, make sure you type in “6.1” instead of “6.10” as the method will not work otherwise.
Also take note that should the system expect a different version of perf other than 6.1, you can just alter the command to match what the system is looking for. The solution to this issue was found in the following stackoverflow post.
5) Now when we check for perf’s version again, we will have perf being detected by the system!
Using Perf
Using perf is really easy! Let’s say you have already compiled your program called “program“ and it is in your current directory. Simply type the following:
perf stat ./program
Perf will then run the program and record the amount of time needed for the code to finish running! Find your project and type in
perf stat ./<executable name>
Your code will run and a report on how long it took will be generated. Below is an example:

Results
The FizzBuzz tests were done 5 times for both C and Assembly with the FuzzBuzz counter counting up to 1 million to get the average execution time. The results were as followed:
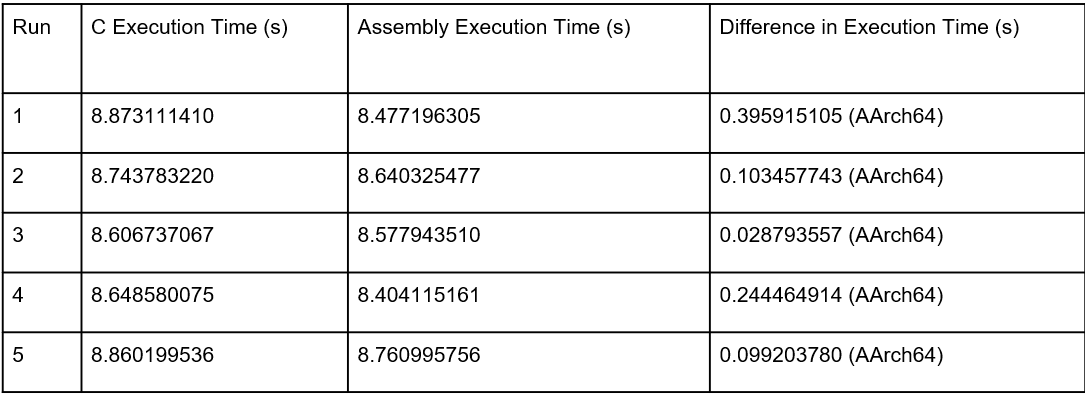
The average execution time for C is 8.7464822616s
The average execution time for Assembly is 8.5721152418s
The average difference in execution time is 0.1743670198s
From the information gathered, we can conclude that on average, Assembly runs faster than C.